systemtap
SystemTap is a tracing and probing tool that allows users to study and monitor the activities of the computer system (particularly, the kernel) in fine detail. It provides information similar to the output of tools like netstat, ps, top, and iostat, but is designed to provide more filtering and analysis options for collected information.
SystemTap 是一种跟踪和探测工具,允许用户详细研究和监视计算机系统(特别是内核)的活动。它提供的信息类似于 netstat、ps、top 和 iostat 等工具的输出,但旨在为收集的信息提供更多过滤和分析选项。
SystemTap 的当前迭代允许在探测各种内核的内核空间事件时有多种选择。然而,SystemTap 探测用户空间事件的能力取决于内核支持(Utrace 机制),这在许多内核中是不可用的。因此,只有某些内核版本支持用户空间探测。
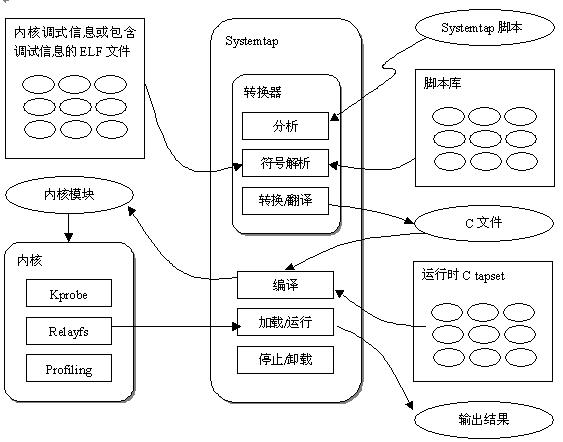
SystemTap 与许多命令行工具一起分发,允许您监视系统的活动。 stap 命令从 SystemTap 脚本中读取探测指令,将这些指令转换为 C 代码,构建内核模块,并将其加载到正在运行的 Linux 内核中。 staprun 命令运行 SystemTap 检测,即在交叉检测期间从 SystemTap 脚本构建的内核模块。
安装
安装systemtap
Systemtap还需内核相关信息来放置探针,在Red Hat系统里面叫做debug-info,而在ubuntu下叫 debug symbols, 简称dbgsym。这些包我们可以使用stap-prep命令来安装各种依赖,若安装失败,我们可以使用下面脚本来完成:
#!/bin/sh

sudo apt install -y systemtap
sudo apt-key adv --keyserver keyserver.ubuntu.com --recv-keys C8CAB6595FDFF622

codename=$(lsb_release -c | awk '{print $2}') # ubuntu发行版本名称
sudo tee /etc/apt/sources.list.d/ddebs.list << EOF
deb http://ddebs.ubuntu.com/ ${codename} main restricted universe multiverse
deb http://ddebs.ubuntu.com/ ${codename}-updates main restricted universe multiverse
#deb http://ddebs.ubuntu.com/ ${codename}-security main restricted universe multiverse
deb http://ddebs.ubuntu.com/ ${codename}-proposed main restricted universe multiverse
EOF

sudo apt update
sudo apt install -y linux-image-$(uname -r)-dbgsym
sudo apt install -y linux-headers-$(uname -r)
交叉检测
在某些情况下公司政策可能会禁止管理员在特定机器上安装提供编译器或调试信息的 RPM 包,从而阻止 SystemTap 的部署。要解决此问题,SystemTap 允许使用交叉检测(cross-instrumentation)。首先我们要明确三个概念:
-
Instrumentation module(检测模块)
the kernel module built from a SystemTap script. The SystemTap module is built on the host system, and will be loaded on the target kernel of target system. - Host system
the system on which you compile the instrumentation modules from SystemTap scripts in order to load them on target systems. 主机系统,用于构建检测模块,非生产服务器,可称为编译机。
-
Target system
the system for which you are building the instrumentation modules from SystemTap scripts. 目标系统,用于运行检测模块,也就是每一个我们要诊断的生产服务器。
-
Target kernel
the kernel of the target system. This is the kernel on which you intend to load or run the instrumentation module. 目标系统的内核。
交叉检测流程:
- 在生产服务器安装
systemtap-runtime包 - 通过
uname -r命令获取生成服务器的内核版本 -
在编译机上面安装SystemTap,并生成检测模块 > stap -p4 -r kernel_version script -m module_name > 示例:stap -r 2.6.18-92.1.10.el5 -e 'probe vfs.read {exit()}' -m simple
-
将检测模块复制到生产服务器上面,然后执行 > staprun module_name.ko
第一个测试脚本
sudo stap -e 'probe begin {printf("hello world\n"); exit()}'
sudo stap -v -e 'probe vfs.read {printf("read performed\n"); exit()}'
sudo stap -e 'probe timer.s(4){rintf("hello world\n")}'
sudo stap -e 'probe syscall.open,syscall.openat { printf ("%s(%d) %s\n", execname(), pid(), pp())}'
工作原理
The essential idea behind a SystemTap script is to name events, and to give them handlers. When SystemTap runs the script, SystemTap monitors for the event; once the event occurs, the Linux kernel then runs the handler as a quick sub-routine, then resumes.
There are several kind of events; entering/exiting a function, timer expiration, session termination, etc. A handler is a series of script language statements that specify the work to be done whenever the event occurs. This work normally includes extracting data from the event context, storing them into internal variables, and printing results.
An event and its corresponding handler is collectively called a probe. A SystemTap script can have multiple probes.
A probe's handler is commonly referred to as a probe body.
SystemTap 基本思想是命名事件,并为它们提供处理程序。每当发生指定的事件时,内核都会将处理程序视为子例程运行,然后继续运行。有一系列的事件,例如进入或退出函数,计时器到期或整个SystemTap会话的开始和停止。处理程序是一系列脚本语言语句,用于指定事件发生时要完成的工作。这项工作通常包含从事件上下文中提取数据,将其存储到内部变量或打印结果。
SystemTap 的工作原理是将脚本翻译成C语言,执行C编译器创建一个内核模块。当模块被加载后,通过挂载到内核来激活所有的探测事件。然后,当事件发生再任何处理器上时,编译后的处理程序就运行,最终,SystemTap会话停止,Hook取消,内核模块被移除,整个过程由命令行程序stap驱动。
SystemTap scripts
SystemTap脚本文件拓展名称是.stp,脚本里面包含的探针(probes)格式如下:
probe event {statements}
SystemTap 运行一个探针有多个事件;多个事件由逗号 (,) 分隔。如果在单个探测器中指定了多个事件,则 SystemTap 将在发生任何指定事件时执行处理程序。
每个探针都有一个对应的语句块。此语句块括在大括号 ({ }) 中,包含每个事件要执行的语句。 SystemTap 依次执行这些语句;多个语句之间通常不需要特殊的分隔符或终止符。
SystemTap 允许您编写函数来分解出由许多探测器使用的代码。因此,您无需在多个探针中重复编写相同系列的语句,而只需将指令放在函数中,如下所示:
事件
-
syscall.system_call
系统调用, 比如syscall.open - syscall.system_call.return
系统调用返回时,比如syscall.open.return - vfs.file_operation
Virtual File System (VFS)操作时,比如vfs.read - vfs.file_operation.return
Virtual File System (VFS)操作返回时,比如vfs.read.return
-
kernel.function("function")
内核函数调用时,即进入内核函数时。我们可以使用通配符*,表示函数。
- kernel.function("*") 表示所有的内核函数
- kernel.function("*net/socket.c") 表示net/socket.c源文件内的所有内核函数
- kernel.function("function").return
内核函数调用完成,退出时
-
module("module").function("function")
模块内函数调用时,比如module("ext3").function("*") - module("module").function("function").return
模块内函数调用完成返回时 - begin
The startup of a SystemTap session,systemptap脚本即将运行 - end
The startup of a SystemTap session
-
timer events
定时器事件。比如每隔4s触发的事件是timer.s(4) 其他定时器事件有: - timer.ms(milliseconds) - timer.us(microseconds) - timer.ns(nanoseconds) - timer.hz(hertz) - timer.jiffies(jiffies) - timer.profile 每个CPU上周期触发的定时器
-
process("a.out").function("foo*")
a.out 中函数名前缀为foo的函数信息 - process("a.out").statement("*@main.c:200")
a.out中文件main.c 200行处的状态
列出进程a.out所有可用探点:
# vagrant@vagrant:/usr/src/linux-headers-5.4.0-81$ grep -nr 'SYSCALL_DEFINE3(open' ./
stap -l 'process("a.out").function("*")'
SystemTap functions
- tid() 当前线程id
- pid() 当前进程id
- uid() 当前用户id
- execname() 当前进程名称
- cpu() 当前cpu编号
- gettimeofday_s() 秒时间戳
- get_cycles(), 硬件周期计数器快照
- pp() 探测点事件名称
- ppfunc() 探测点触发的函数名称
- print_backtrace() 打印内核栈
- print_ubacktrace() 打印用户空间栈
- thread_indent() 缩进打印系统调用栈
-
target()
等于-x或者-c选项的值,对于stap script -x process_ID,target()等于process_ID。 对于stap script -c command,target()等于command - printf() 打印输出。格式化选项支持%s和%d
target()示例:
Target Variables
对于局部变量,我们可以根据变量名称直接访问
对于全局变量,我们可以使用@var访问:
@var("varname", "/path/to/exe/or/lib")
示例:
stap -e 'probe kernel.function("vfs_read") {
           printf ("current files_stat max_files: %d\n",
                   @var("files_stat@fs/file_table.c")->max_files);
           exit(); }'
我们可以列出可用探点和局部变量:
stap -L 'process("a.out").function("*")'
stap -L 'kernel.function("vfs_read")'
stap -L 'kernel.function("sched_getaffinity")'
systemap内置几个变量:
-
$$vars
\(\(locals和\)\)parms组合体,等效于sprintf("parm1=%x ... parmN=%x var1=%x ... varN=%x", parm1, ..., parmN, var1, ..., varN) - $$locals 局部变量 $$parms 函数参数 $$return 函数返回值
对于指针类型,上面三个变量默认都打印指针值,如果要显示指针指向的值,可以在加上\(或\)$后缀。
示例:
SystemTap Scripts基本操作
注释
if/else/while/for
function if_expr() {
    i = 0
    if (i == 1)
        printf("[if] i = %d\n", i);
    else
        printf("[else] i = %d\n", i);
}

function while_expr() {
    i = 0;
    while (i != 2)
        printf("[while] i = %d\n", i++);
}

function for_expr() {
    for (i = 0; i < 2; i++)
        printf("[for] i = %d\n", i);
}
示例:
global countread, countnonread
probe kernel.function("vfs_read"),kernel.function("vfs_write")
{
  if (probefunc()=="vfs_read")
    countread ++
  else
    countnonread ++
}
probe timer.s(5) { exit() }
probe end
{
  printf("VFS reads total %d\n VFS writes total %d\n", countread, countnonread)
}
比较操作
字符串
function str() {
    uid = uid();
    s_uid = sprint(uid);
    f_uid = "a" . s_uid
    printf("uid: %d-%s-%s\n", uid, s_uid, f_uid); // uid: 0-0-a0

    // exit();
}
元组
global t; // 声明元组
global tpl[400]; // 声明一个400容量的元组

t["a"]++;  // t["a"] 初始值默认为0, ++ 变成 1
t["a"] = 4396; // 赋值为4396

tpl["a", pid()]++; // 两个元素
tpl["b", tid()]++;

 遍历(升序), 最多遍历5次
foreach([key, value] in t+ limit 5)
    printf("%s: %d\n", key, value)
聚集统计
t["abc", 5487] <<< 2
t["abc", 5487] <<< 3
t["abc", 5487] <<< 1

具体结构如下:
t["abc",5487] @count=3 @min=1 @max=3 @sum=6 @avg=2
global reads
probe vfs.read
{
  reads[execname(),pid()] <<< 1
}
probe timer.s(3)
{
  foreach([var1,var2] in reads)
    printf("%s (%d) : %d \n", var1, var2, @count(reads[var1,var2]))
}
Command-Line Arguments
我们可以通过$访问命令行参数:
更多示例
- 探测go应用cpu pprof时候的系统调用
probe kernel.function("do_setitimer") {
    if(execname()=="pprof") {
        printf("%s\n", $$params$$)
        printf("%d\n", $value->it_interval->tv_sec);
    }
}
- open系统调用
probe kernel.function("sys_open").call {
    printf("%s call %s\n", execname(), ppfunc());
}

probe kernel.function("sys_open").return {
    printf("%s call %s return\n", execname(), ppfunc());
}
- 定时器
- cpu采样
global bts;

probe timer.profile {
    if (pid() == 5291)
        bts[backtrace(), ubacktrace()] <<< 1
}

probe timer.s(10) {
    foreach([k, u] in bts-) {
        print_stack(k);
        print_ustack(u);
        printf("\\t%d\\n", @count(bts[k, u]));
    }
    exit();
}
- socket trace
#! /usr/bin/env stap

probe kernel.function("*@net/socket.c").call {
  printf ("%s -> %s\n", thread_indent(1), ppfunc())
}
probe kernel.function("*@net/socket.c").return {
  printf ("%s <- %s\n", thread_indent(-1), ppfunc())
}
- tcp connections
#! /usr/bin/env stap

probe begin {
  printf("%6s %16s %6s %6s %16s\n",
         "UID", "CMD", "PID", "PORT", "IP_SOURCE")
}

probe kernel.{function("tcp_accept"),function("inet_csk_accept")}.return? {
  sock = $return
  if (sock != 0)
    printf("%6d %16s %6d %6d %16s\n", uid(), execname(), pid(),
           inet_get_local_port(sock), inet_get_ip_source(sock))
}
- 实现类似tcpdump功能
#! /usr/bin/env stap

// A TCP dump like example

probe begin, timer.s(1) {
  printf("-----------------------------------------------------------------\n")
  printf("       Source IP         Dest IP  SPort  DPort  U  A  P  R  S  F \n")
  printf("-----------------------------------------------------------------\n")
}

probe udp.recvmsg /* ,udp.sendmsg */ {
  printf(" %15s %15s  %5d  %5d  UDP\n",
         saddr, daddr, sport, dport)
}

probe tcp.receive {
  printf(" %15s %15s  %5d  %5d  %d  %d  %d  %d  %d  %d\n",
         saddr, daddr, sport, dport, urg, ack, psh, rst, syn, fin)
}
- timestamp()函数实现
#! /usr/bin/env stap

global start

function timestamp:long() { return gettimeofday_us() - start }

function proc:string() { return sprintf("%d (%s)", pid(), execname()) }

probe begin { start = gettimeofday_us() }
- I/O Monitoring (By Device)
#! /usr/bin/env stap

global device_of_interest

probe begin {
  /* The following is not the most efficient way to do this.
      One could directly put the result of usrdev2kerndev()
      into device_of_interest.  However, want to test out
      the other device functions */
  dev = usrdev2kerndev($1)
  device_of_interest = MKDEV(MAJOR(dev), MINOR(dev))
}

probe vfs.{write,read}
{
  if (dev == device_of_interest)
    printf ("%s(%d) %s 0x%x\n",
            execname(), pid(), ppfunc(), dev)
}
- Monitoring Changes to File Attributes
#! /usr/bin/env stap

global ATTR_MODE = 1

probe kernel.function("notify_change") {
  dev_nr = $dentry->d_inode->i_sb->s_dev
  inode_nr = $dentry->d_inode->i_ino

  if (dev_nr == MKDEV($1,$2) # major/minor device
      && inode_nr == $3
      && $attr->ia_valid & ATTR_MODE)
    printf ("%s(%d) %s 0x%x/%u %o %d\n",
      execname(), pid(), ppfunc(), dev_nr, inode_nr, $attr->ia_mode, uid())
}
- Counting Function Calls Made
使用方式:stap functioncallcount.stp "@mm/.c"
#! /usr/bin/env stap
# The following line command will probe all the functions
# in kernel's memory management code:
#
# stap  functioncallcount.stp "*@mm/*.c"

probe kernel.function(@1).call {  # probe functions listed on commandline
  called[ppfunc()] <<< 1  # add a count efficiently
}

global called

probe end {
  foreach (fn in called-)  # Sort by call count (in decreasing order)
  #       (fn+ in called)  # Sort by function name
    printf("%s %d\n", fn, @count(called[fn]))
  exit()
}